

By the Time It's on Your Dashboard, the Damage Is Done
By the time a problem shows up on an enrollment dashboard, it's already old news. The damage happened months, sometimes years, before anyone saw a number move.
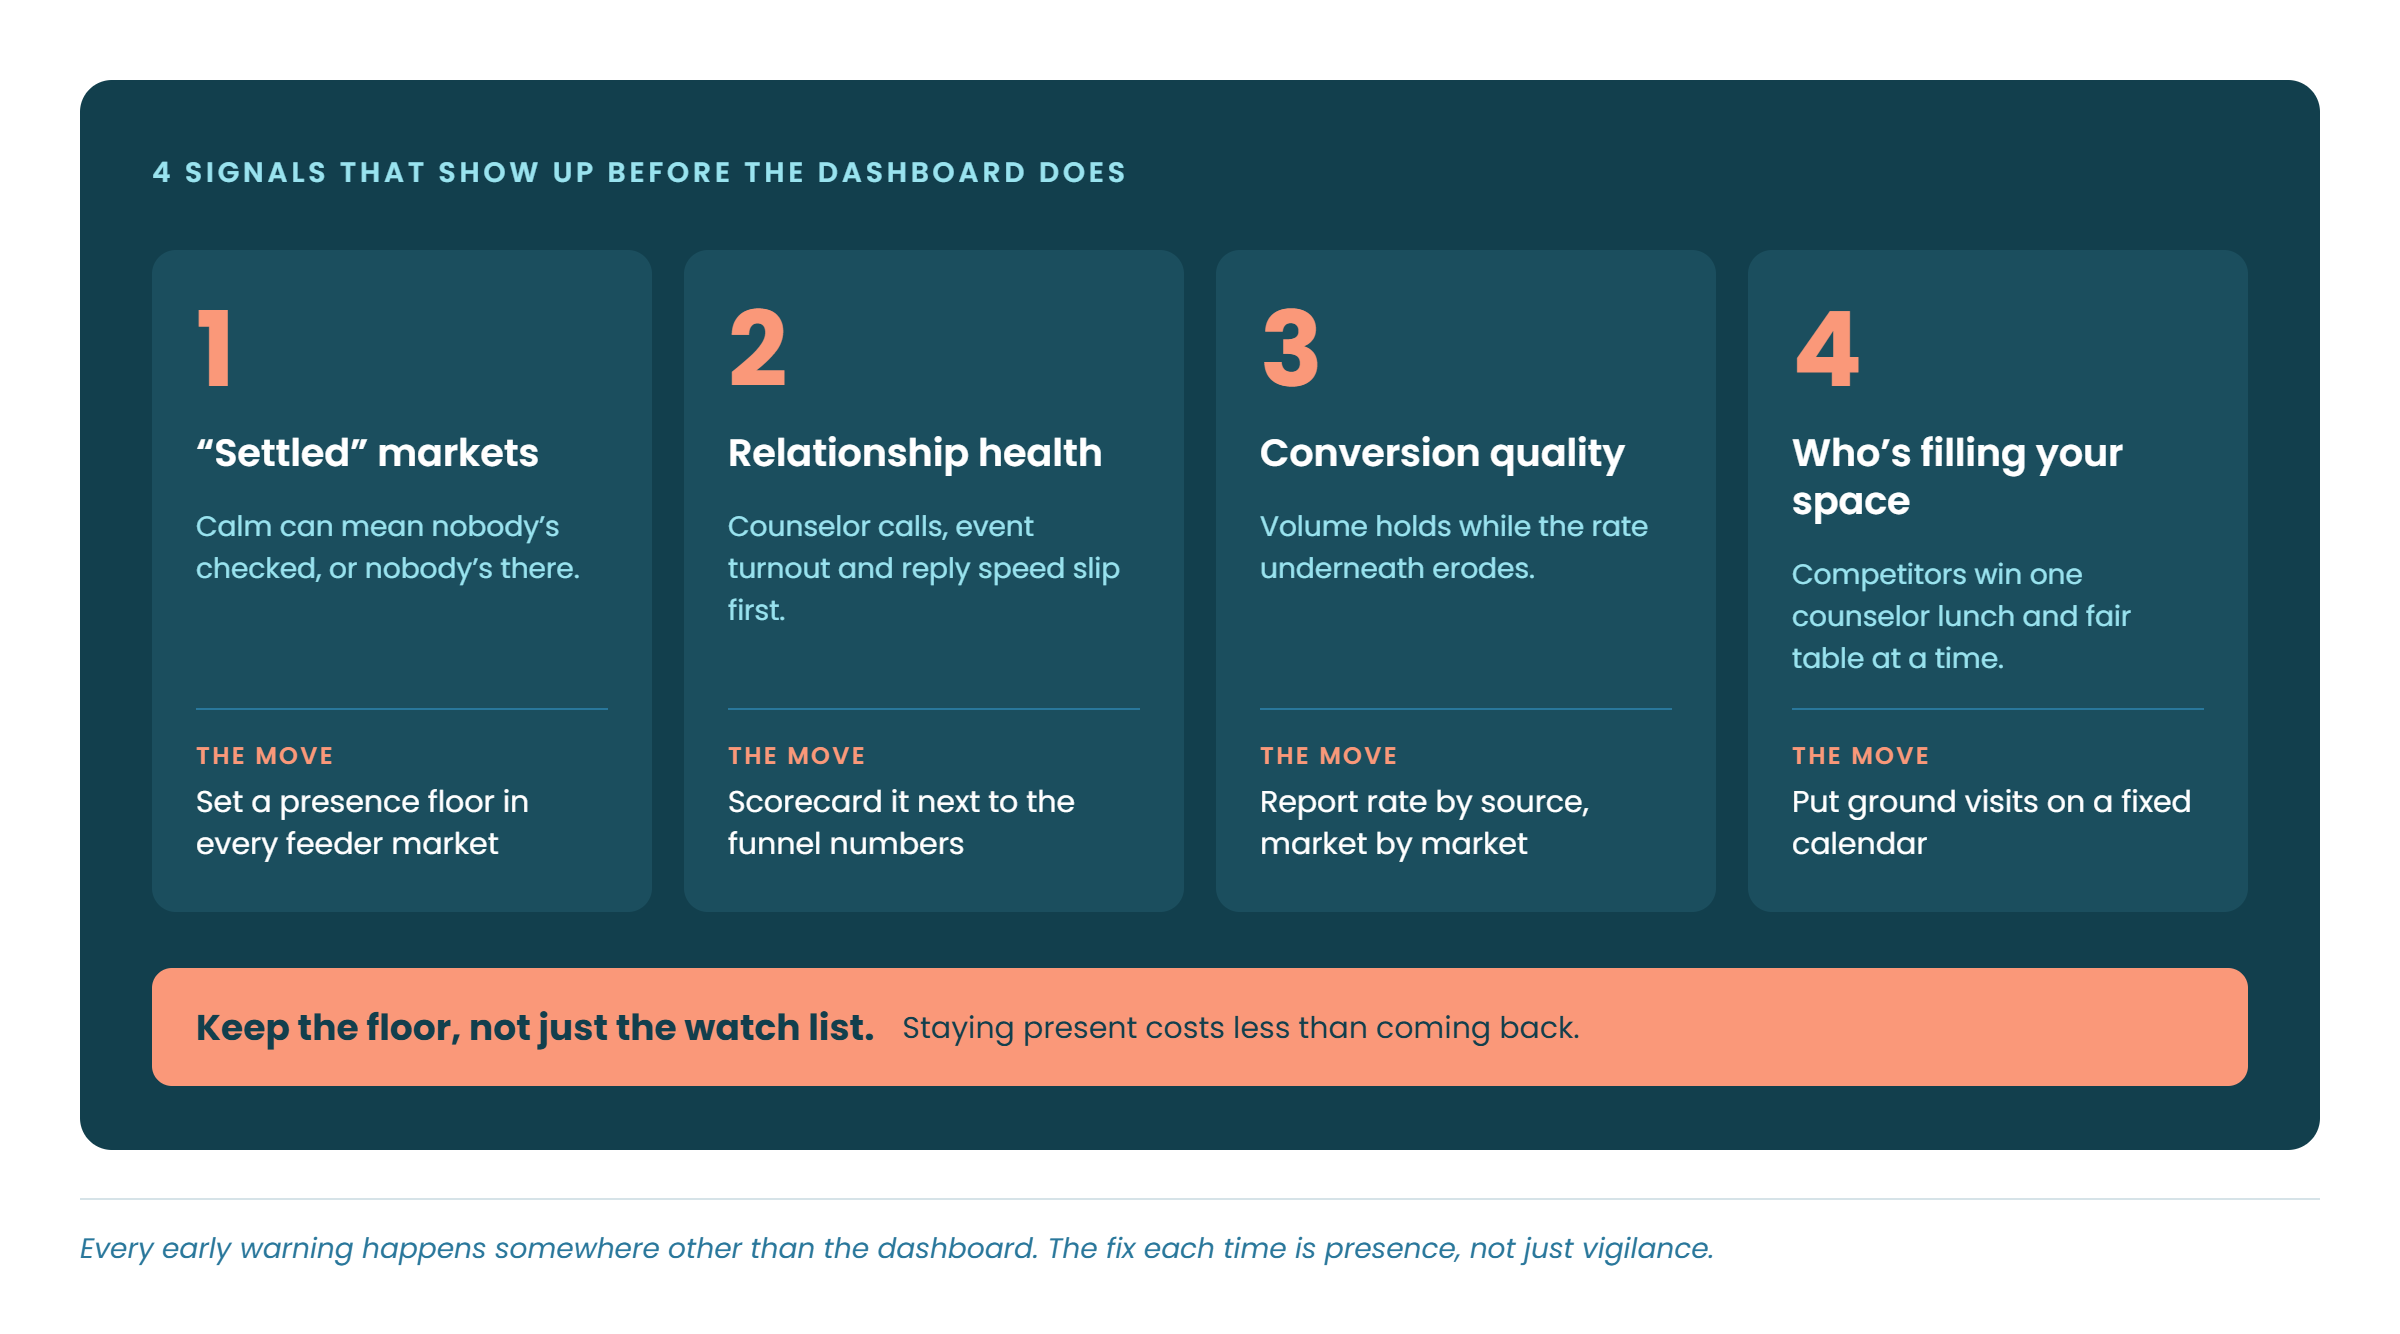
4 signals show up before that damage ever hits a report: whether you're maintaining presence in a market you consider secure, how relationships and response speed are holding up away from the campaign metrics, whether conversion quality is holding even when volume looks fine, and who's quietly showing up in the space you used to occupy. A recent episode of Higher Ed Pulse laid out exactly why all 4 matter, and more importantly, why the fix isn't watching harder. It's staying put.
Mallory Willsea, a media and marketing consultant and host of Higher Ed Pulse, opened this recent episode by naming the problem directly: "There's a trap in enrollment that nobody warns you about: residual momentum." Her guest was Mehgan Cabrera, Director of Strategic Enrollment Management at Okanagan College, who spent the conversation explaining exactly what that trap looks like from the inside.
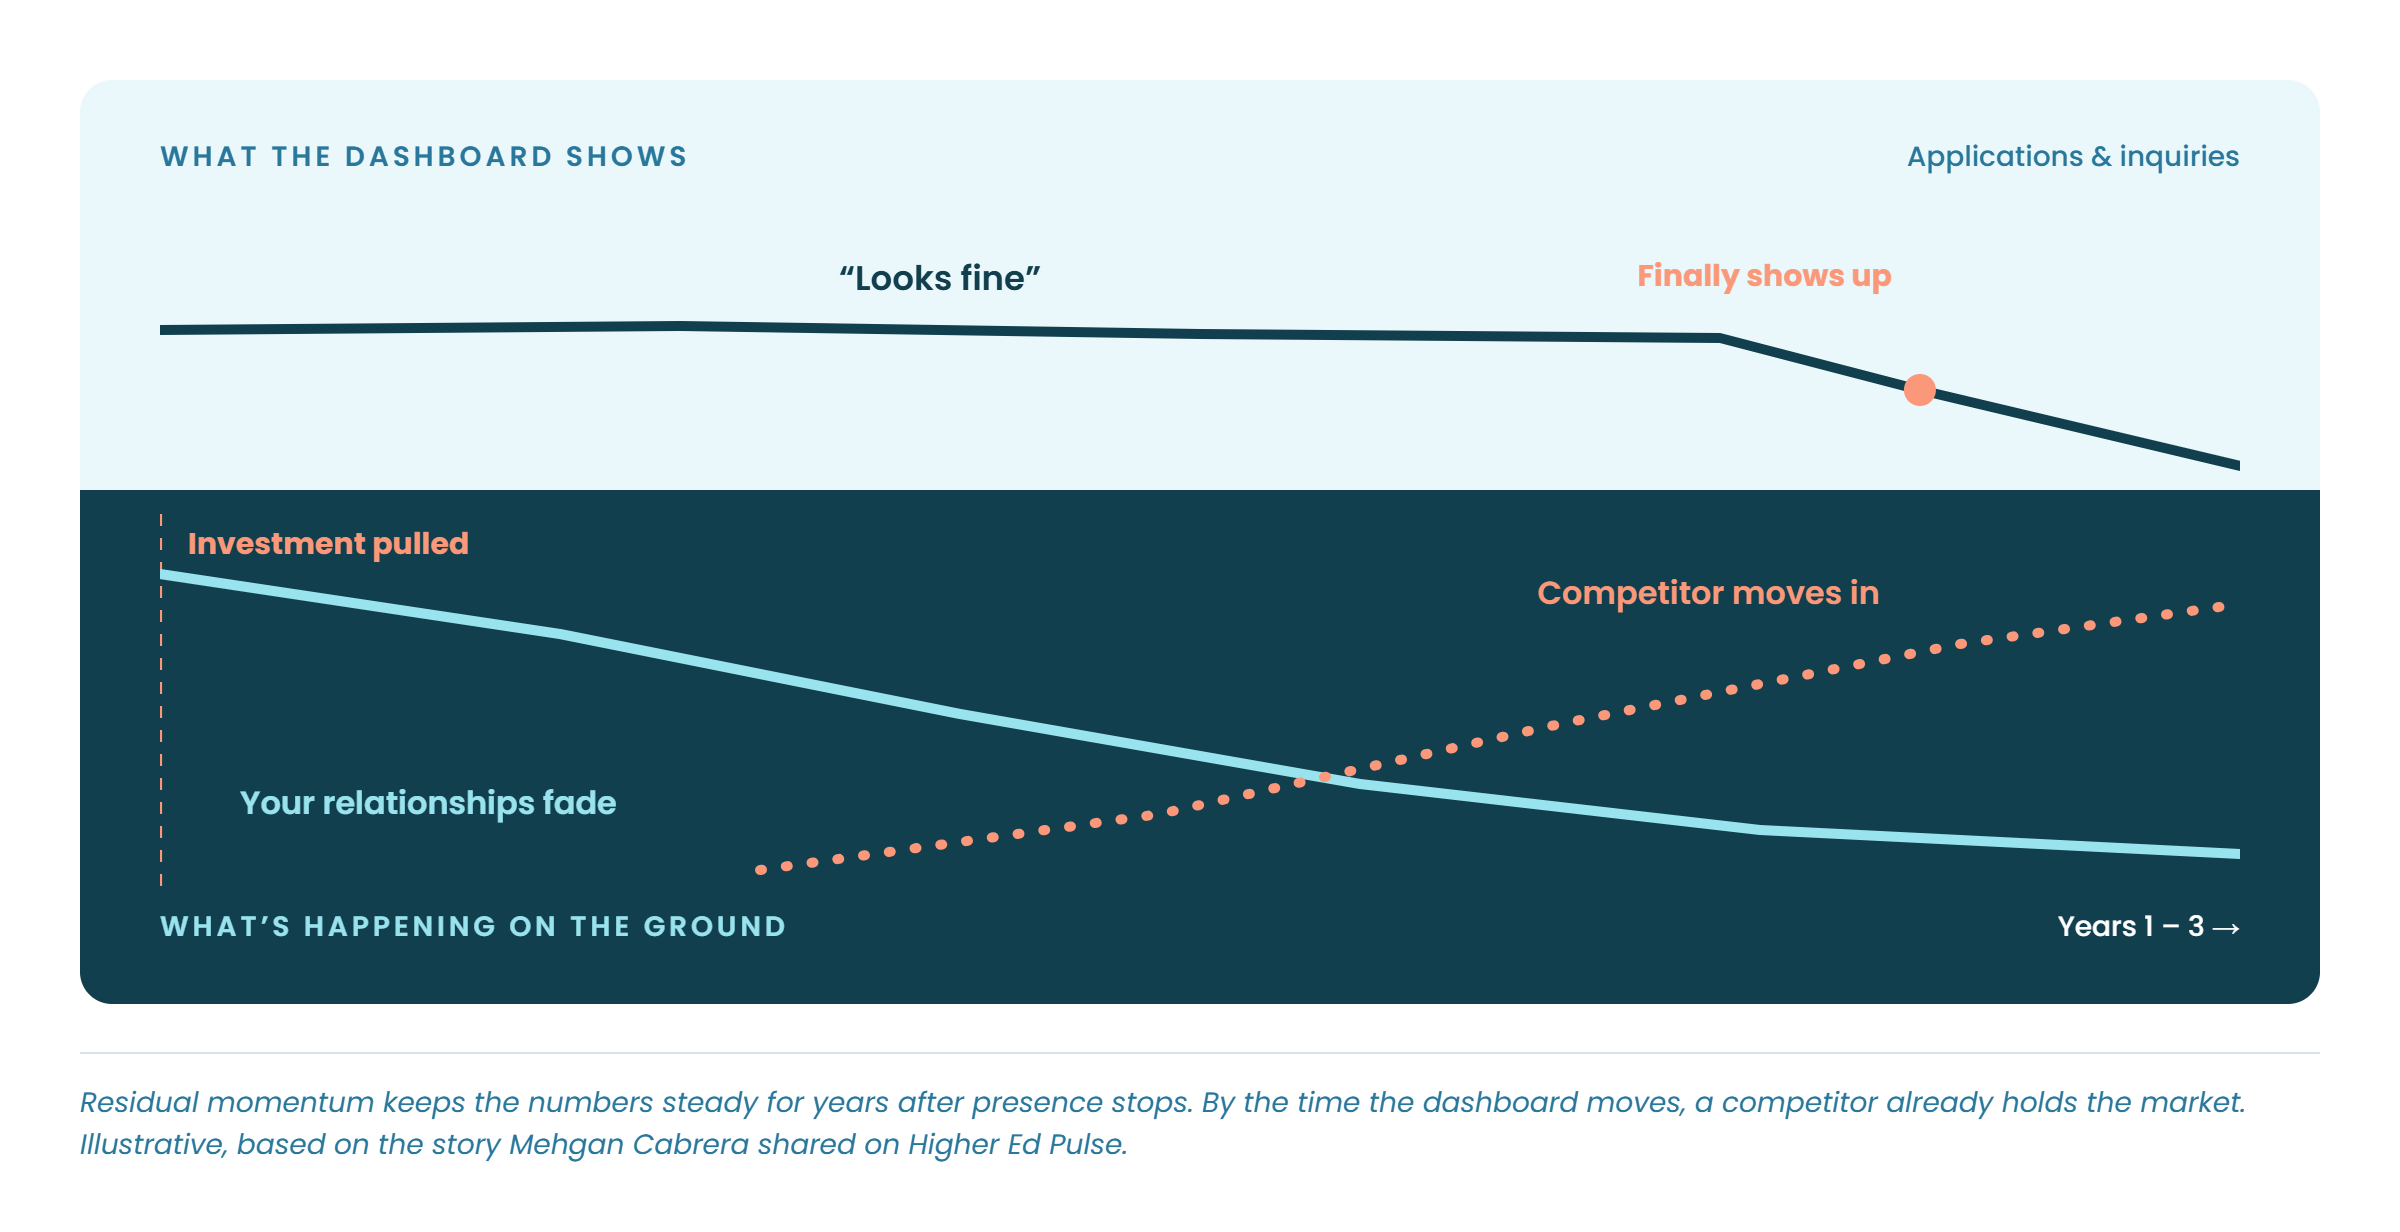
Mehgan told a compelling story that makes the case better than any framework. At a previous institution, her team pulled marketing investment from a feeder market they'd held for a long time. Applications held steady, and inquiry volume looked fine for 2 years straight. Then a competitor moved in, one relationship at a time, and rebuilding the market afterward cost more than staying present ever would have. [Listen to the full conversation on Higher Ed Pulse.]
Here's how each of the 4 signals played out, what it means for anyone managing enrollment right now, and why the answer each time comes back to presence, not just vigilance.
1. Watch the markets you already consider settled
What her story showed: A market held for years stopped getting watched closely, and that is exactly when a competitor moved in. Mehgan put it simply: "markets will produce momentum for quite some time," meaning the numbers look completely normal while the ground underneath is already shifting.
Our take: Most institutions review market health once a year, usually during budget season, and treat anything not flagged as a problem as settled for the rest of the year. That gap between reviews is exactly where competitors move in unnoticed, and by the time anyone circles back, the shift is already old news.
The move: Set a presence floor, not just a watch list. Every feeder market considered safe keeps a minimum baseline of visibility and relationship touchpoints, even when the metrics say you could pull back. Pair it with a competitor scan twice a year, tied to a specific owner, but the floor is the actual point. Continuous presence costs less than an emergency return once a competitor is already inside the market.
A calm market might mean nobody has checked things in a while. Or it might mean nobody's actually there.
2. Track relationship signals separately from campaign signals
What her story showed: Counselor calls, event attendance, and reply speed caught the shift well before inquiry volume did. Response time in particular was one of the earliest tells, sliding long before anything moved on a dashboard.
Our take: Email opens and click rates measure a campaign's performance. A relationship's health, including how fast anyone responds when a school reaches out, is a separate metric entirely. Mehgan framed the philosophy behind that distinction in one line: "It's our student, right? It's not whose department." The relationship belongs to the institution, no matter which department happens to own the dashboard. She was direct about the cost of learning this the hard way: "I don't make those mistakes twice."
The move: Build a relationship scorecard for top feeder schools that tracks call frequency, event turnout, and reply speed, all reviewed on the same cadence as the funnel numbers and at the same leadership level. Response time doesn't get to sit off to the side as an ops metric. It belongs next to inquiry and application counts as a leading indicator.
Numbers only tell you what already happened. Relationships, and how fast you show up for them, tell you what's coming.
3. Report conversion quality alongside conversion volume
What her story showed: Volume held steady in her example while conversion softened underneath it, exactly the kind of shift a standard dashboard is built to miss.
Our take: Most dashboards report raw counts by default: inquiry volume, total applications. Mallory named exactly why that's a problem partway through the episode: "the dashboard's the last place that failure shows up, not the first." A count holds steady for a long time while the rate underneath it erodes, and the rate is always the earlier warning.
The move: Push for conversion rate by source as a standing metric, tracked market by market, reported right alongside the raw counts.
Volume tells a comfortable story. Rate tells the truer one.
4. Track who's showing up in the space you used to occupy
What her story showed: The competitor didn't win the market with a campaign. They won it one relationship at a time, showing up at the counselor lunches, the fairs, the campus visits that used to be Mehgan's team's territory. That's a different signal than a relationship going quiet. It's a competitor actively occupying the physical and social space a market leaves behind the moment presence stops.
Our take: Section 2 tracks whether your own relationships are healthy. This is the outside view: whose name is coming up in counselor conversations that didn't used to, who's tabling at the events you used to own, who a school mentions calling them first. Most teams only pick this up secondhand, if at all, usually from a counselor mentioning it in passing well after the fact.
The move: This isn't a signal to watch for, it's a gap to not leave open in the first place. Put recurring ground-level touchpoints, counselor visits, event tables, campus check-ins, on a fixed calendar in every feeder market, independent of whether that market is currently flashing any warning sign. A market doesn't need a reason to earn a visit. The visit is what keeps the vacuum from opening.
A competitor can't move into space you're still standing in.
Presence wins the long game
Every signal above happens somewhere other than a dashboard, and that's the entire point. A dashboard can only report on damage well after the fact.
But the real lesson isn't to watch those markets more closely while you're gone. It's not to leave. Mehgan's team didn't lose their feeder market because they missed a signal, they lost it because presence had already stopped, and momentum was the only thing left standing in for it. Watching harder only buys a faster alert once a competitor is already inside; it doesn't stop them from getting in.
Staying present is the cheaper option, every time. Continuity costs a fraction of what re-entry costs once a market has to be rebuilt relationship by relationship. That's the trade Mehgan is naming when she calls momentum a trap: the market looks fine for exactly as long as it takes a competitor to notice nobody's there anymore, and by then it's too late to just watch your way back in.
The institutions holding their ground longest right now aren't the ones with the fastest alerts. They're the ones who never fully left. If a market feels settled enough to defund, that's the moment to double down on presence instead, because rebuilding it later will cost more than staying ever would have.
Structural presence outperforms stop-start investment every time. Keep the floor, not just the watch list.
This piece was sparked by a conversation between Mehgan Cabrera and Mallory Willsea on Higher Ed Pulse. Hear the original episode on Apple Podcasts or Spotify.
